|
|
||
|---|---|---|
| FScanpy | ||
| tutorial | ||
| FScanpy_Demo.ipynb | ||
| README.md | ||
| example_plot_prediction.py | ||
| pyproject.toml | ||
| setup.py | ||
README.md
FScanpy
A Machine Learning-Based Framework for Programmed Ribosomal Frameshifting Prediction
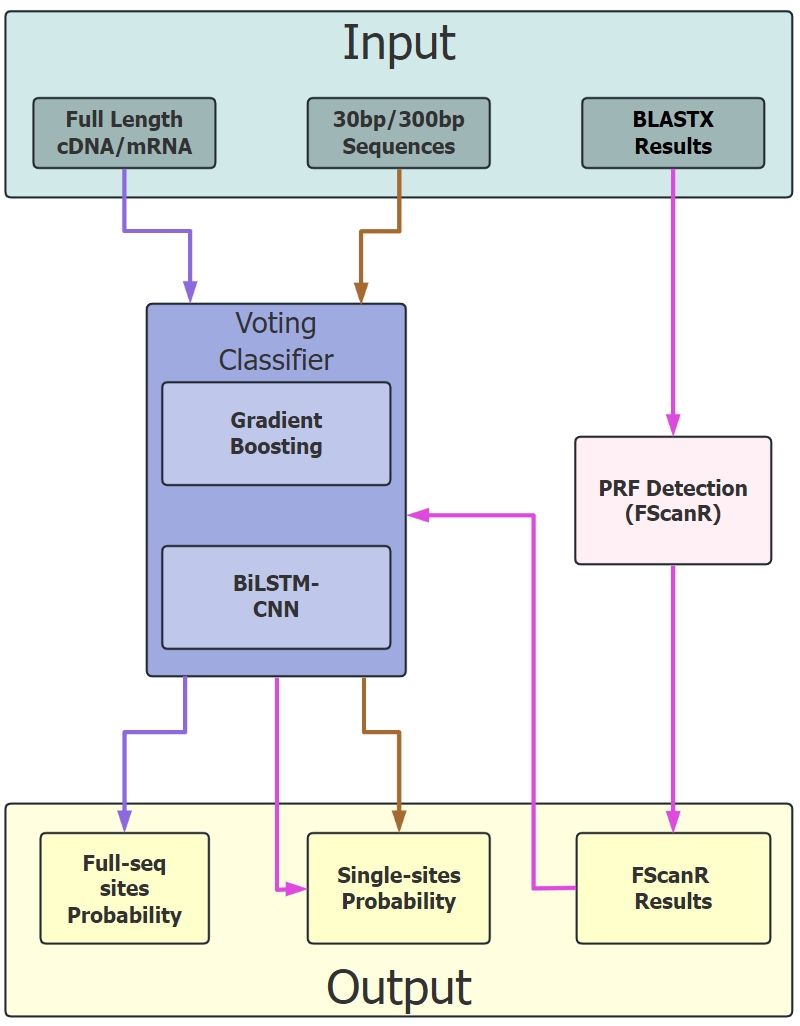
FScanpy is a comprehensive Python package designed for the prediction of Programmed Ribosomal Frameshifting (PRF) sites in nucleotide sequences. By integrating advanced machine learning approaches (HistGradientBoosting and BiLSTM-CNN) with the established FScanR framework, FScanpy provides robust and accurate PRF site predictions. The package requires input sequences to be in the positive (5' to 3') orientation.
For detailed documentation and usage examples, please refer to our tutorial.
🚀 What's New in v0.3.0
Model Naming Optimization
- Short Model (
short.pkl): HistGradientBoosting model for rapid screening - Long Model (
long.pkl): BiLSTM-CNN model for detailed analysis - Unified Interface: Consistent parameter naming and clearer output fields
Performance Improvements
- Faster Prediction: Optimized model type detection and reduced redundant operations
- Better Error Handling: More informative error messages and robust exception handling
- Code Quality: Reduced code duplication and improved maintainability
🎨 New Visualization Features
- Sequence Plotting: Built-in function for visualizing PRF prediction results
- Dual Threshold Filtering: Separate filtering for Short and Long models
- Interactive Graphics: Heatmap and bar chart visualization
- Export Options: Support for PNG and PDF output formats
⚖️ Ensemble Weighting System
- Flexible Ensemble: Control the contribution of Short and Long models
- Weight Validation: Automatic parameter validation and error handling
- Clear Naming:
ensemble_weightparameter for intuitive usage - Visual Feedback: Weight ratios displayed in plots and results
🔧 API Improvements
- Method Renaming: More intuitive method names
predict_sequence(): Replacespredict_full()for sequence predictionpredict_regions(): Replacespredict_region()for batch prediction
- Field Standardization: Consistent output field naming
Ensemble_Probability: Main prediction result (replacesVoting_Probability)Short_Sequence/Long_Sequence: Clear sequence field names
- Backward Compatibility: Deprecated methods still work with warnings
Core Features
- Sequence Feature Extraction: Support for extracting features from nucleic acid sequences, including base composition, k-mer features, and positional features.
- Frameshift Hotspot Region Prediction: Predict potential PRF sites in nucleotide sequences using machine learning models.
- Feature Extraction: Extract relevant features from sequences to assist in prediction.
- Cross-Species Support: Built-in databases for viruses, marine phages, Euplotes, etc., enabling PRF prediction across various species.
- Visualization Tools: Built-in plotting functions for result visualization and analysis.
- Ensemble Modeling: Customizable ensemble weights for different prediction strategies.
Main Advantages
- High Accuracy: Integrates multiple machine learning models to provide accurate PRF site predictions.
- Efficiency: Utilizes a sliding window approach and feature extraction techniques to rapidly scan sequences.
- Versatility: Supports PRF prediction across various species and can be combined with the FScanR framework for enhanced accuracy.
- User-Friendly: Comes with detailed documentation and usage examples, making it easy for researchers to use.
- Flexible: Provides different resolutions to suit different using situations.
Quick Start
Basic Prediction
from FScanpy import predict_prf

# Single sequence prediction with default ensemble weights (0.4:0.6)
sequence = "ATGCGTACGT..."
results = predict_prf(sequence=sequence)
print(results[['Position', 'Short_Probability', 'Long_Probability', 'Ensemble_Probability']].head())
Custom Ensemble Weighting
# Adjust model weights for different prediction strategies
results_long_dominant = predict_prf(sequence=sequence, ensemble_weight=0.3)   # 3:7 ratio (Long dominant)
results_equal_weight = predict_prf(sequence=sequence, ensemble_weight=0.5)    # 5:5 ratio (Equal weight)
results_short_dominant = predict_prf(sequence=sequence, ensemble_weight=0.7)  # 7:3 ratio (Short dominant)

# Compare ensemble probabilities
print("Long dominant:", results_long_dominant['Ensemble_Probability'].mean())
print("Equal weight:", results_equal_weight['Ensemble_Probability'].mean())
print("Short dominant:", results_short_dominant['Ensemble_Probability'].mean())
Visualization with Custom Weights
from FScanpy import plot_prf_prediction
import matplotlib.pyplot as plt

# Generate prediction plot with custom ensemble weighting
sequence = "ATGCGTACGT..."
results, fig = plot_prf_prediction(
    sequence=sequence,
    short_threshold=0.65,     # HistGB threshold
    long_threshold=0.8,       # BiLSTM-CNN threshold
    ensemble_weight=0.3,      # Custom weight: 30% Short, 70% Long
    title="Long-Dominant Ensemble PRF Prediction (3:7)",
    save_path="prediction_result.png"
)

plt.show()
Advanced Usage with New API
from FScanpy import PRFPredictor
import matplotlib.pyplot as plt

# Create predictor instance
predictor = PRFPredictor()

# Use new sequence prediction method
results = predictor.predict_sequence(
    sequence=sequence,
    ensemble_weight=0.4
)

# Compare different ensemble configurations
weights = [0.2, 0.4, 0.6, 0.8]
weight_names = ["Long 80%", "Balanced", "Short 60%", "Short 80%"]

fig, axes = plt.subplots(2, 2, figsize=(15, 10))
axes = axes.flatten()

for i, (weight, name) in enumerate(zip(weights, weight_names)):
    results = predictor.predict_sequence(sequence=sequence, ensemble_weight=weight)
    ax = axes[i]
    ax.bar(results['Position'], results['Ensemble_Probability'], alpha=0.7)
    ax.set_title(f'{name} (Weight: {weight:.1f}:{1-weight:.1f})')
    ax.set_ylabel('Probability')

plt.tight_layout()
plt.show()
Batch Region Prediction
# Predict multiple 399bp sequences
import pandas as pd

data = pd.DataFrame({
    'Long_Sequence': ['ATGCGT...' * 60, 'GCTATAG...' * 57]  # 399bp sequences
})

results = predict_prf(data=data, ensemble_weight=0.4)
print(results[['Ensemble_Probability', 'Ensemble_Weights']].head())
Installation Requirements
- Python ≥ 3.7
- Dependencies are automatically handled during installation
Option 1: Install via pip
pip install FScanpy
Option 2: Install from source
git clone git@60.204.158.188:yyh/FScanpy-package.git
cd FScanpy-package
pip install -e .
🔄 Migration from Previous Versions
API Changes Summary
# OLD API (deprecated but still works)
results = predict_prf(sequence="ATGC...", short_weight=0.4)
results = predictor.predict_full(sequence, short_weight=0.4)
results = predictor.predict_region(sequences, short_weight=0.4)

# NEW API (recommended)
results = predict_prf(sequence="ATGC...", ensemble_weight=0.4)
results = predictor.predict_sequence(sequence, ensemble_weight=0.4)
results = predictor.predict_regions(sequences, ensemble_weight=0.4)

# Output field changes
# OLD: 'Voting_Probability', 'Weight_Info', '33bp', '399bp'
# NEW: 'Ensemble_Probability', 'Ensemble_Weights', 'Short_Sequence', 'Long_Sequence'

# Visualization with ensemble weights
results, fig = plot_prf_prediction(
    sequence="ATGC...",
    short_threshold=0.65,
    long_threshold=0.8,
    ensemble_weight=0.3  # 30% Short, 70% Long
)
Backward Compatibility
- All old methods still work but will show deprecation warnings
- Old field names are automatically added for compatibility
- Gradual migration is supported
Ensemble Weight Configuration Guide
Recommended Weights for Different Scenarios:
| Scenario | ensemble_weight | Description | Use Case |
|---|---|---|---|
| High Sensitivity | 0.2-0.3 | Long model dominant | Detecting subtle PRF sites |
| Balanced Detection | 0.4-0.5 | Balanced ensemble (recommended) | General purpose prediction |
| Fast Screening | 0.6-0.7 | Short model dominant | Rapid initial screening |
| Equal Contribution | 0.5 | Equal weight to both models | Comparative analysis |
Weight Selection Guidelines:
-
Low ensemble_weight (0.2-0.3):
- Emphasizes Long model (BiLSTM-CNN)
- Better for detecting complex patterns
- Higher sensitivity, may have more false positives
-
High ensemble_weight (0.6-0.8):
- Emphasizes Short model (HistGB)
- Faster computation
- Good for initial screening
- Higher specificity, may miss subtle sites
-
Balanced (0.4-0.5):
- Recommended for most applications
- Good balance of sensitivity and specificity
- Suitable for comprehensive analysis
Output Field Reference
Main Prediction Fields
Short_Probability: HistGradientBoosting model prediction (0-1)Long_Probability: BiLSTM-CNN model prediction (0-1)Ensemble_Probability: Final ensemble prediction (primary result)Ensemble_Weights: Weight configuration information
Sequence Fields
Short_Sequence: 33bp sequence used by Short modelLong_Sequence: 399bp sequence used by Long modelPosition: Position in the original sequenceCodon: 3bp codon at the position
Metadata Fields
Sequence_ID: Identifier for multi-sequence predictions- Additional fields from input DataFrame (for region predictions)
Examples
See example_plot_prediction.py for comprehensive examples of:
- Basic prediction plotting
- Custom threshold configuration
- Ensemble weight parameter usage and comparison
- New API method demonstrations
- Saving plots to files
- Advanced visualization options
Authors
Citation
If you utilize FScanpy in your research, please cite our work:
[Citation details will be added upon publication]